ACTIVE
SOLD
Price
Filters
RSS

CREB: Condo Overview April 1st 2024


Row

Both sales and new listings rose in March. However, with 536 new listings and 449 sales, the sales-to-new listings ratio rose to 84 per cent, preventing any significant monthly change in inventory levels. With 355 units available, inventory levels were 12 per cent below last year’s and 53 per cent below long-term trends for March. The decline in inventory levels was driven by properties priced below $400,000, as inventory levels rose 35 per cent for units priced above $400,000. 

The unadjusted benchmark price trended up in March, reaching $448,700, a monthly gain of nearly three per cent and over 20 per cent higher than levels reported at this time last year. The higher-priced City Centre reported the slowest growth in benchmark prices, with the highest growth reported in the city's most affordable districts.

Apartment Condominium

Sales in March reached 814 units, contributing to the first quarter’s record-high sales of 1,940 units, nearly 31 per cent higher than last year. New listings also improved throughout the first three months of the year, but with a March sales-to-new-listings ratio of 82 per cent and a months-of-supply of one month, conditions favoured apartment condominium sellers. 

Demand for lower-priced homes has supported the growth of apartment-style properties, but the tight conditions have also contributed to further price gains. In March, the benchmark prices reached $337,700, over two per cent higher than last month and 17 per cent higher than levels reported last March.


CALGARY APARTMENTS & TOWNHOUSES

Read

WHEN YOU CHOOSE A LUXURY REALTOR - ASK ARE THEY DESIGNATED?


Luxury real estate professionals achieve GUILD recognition after having completed the luxury home sales and marketing training, becoming an Institute Member, earning the Certified Luxury Home Marketing Specialist™ designation, and have documented performance in the million dollar and above residential market. 

A good agent doesn’t just open the right doors, they also know which doors to open. With so many agents out there, how can you be confident that you’ve selected an expert in working with successful people like you? This is why you need to look for an agent who holds a designation. Designations in the luxury market, such as the Certified Luxury Home Marketing Specialist TM (CLHMS)

Designations require that agents complete specialized training as well as demonstrate a high-level of performance in their market that has been verified by an independent third party.

*As a Member of The Institute for Luxury Home Marketing™, Stewart is part of an International Network of real estate professionals who specialize in the Luxury Market.

Recognized as the mark of accomplishment in luxury markets around the world, the Certified Luxury Home Marketing Specialist™ (CLHMS) designation assures affluent buyers and sellers that the agents who have earned it have the knowledge, experience, competence, and confidence they require.


CALGARY DREAM HOMES

Read

CREB: March Reflects Strong Sellers Market and Price Increases

March reflects strong seller's market and price increases

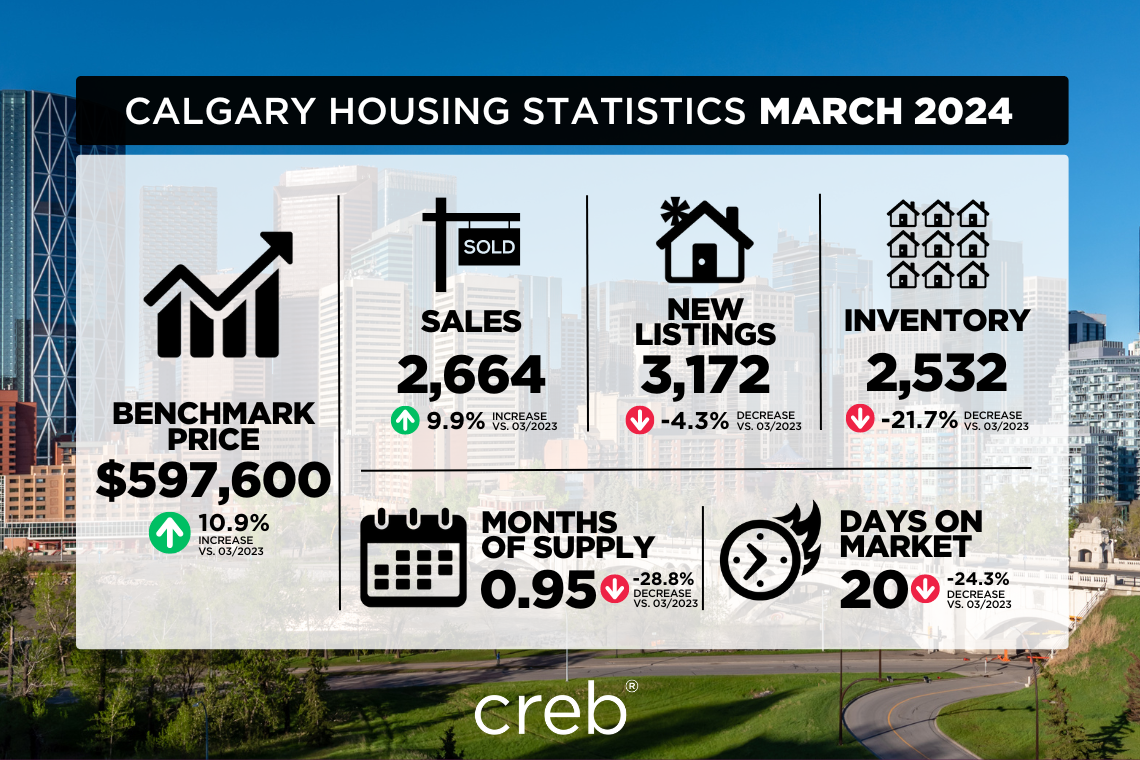
City of Calgary, April 1, 2024 – March sales rose to 2,664 units, a 10 per cent year-over-year gain and much higher than long-term trends. While new listings did pick up over last month, the 3,172 units were still below what we typically see in March and not enough relative to sales to drive any change in the supply situation. In March, the sales-to-new listings ratio rose to 84 per cent, and the months of supply fell below one month.

“We have not seen March conditions this tight since 2006, which is also the last time we reported high levels of interprovincial migration and a months-of-supply below one month," said Ann-Marie Lurie, Chief Economist at CREB®. “Moreover, we are entering the third consecutive year of a market favouring the seller as the two-year spike in migration has driven up demand and contributed to the drop in re-sale and rental supply. Given supply adjustments take time, it is not a surprise that we continue to see upward pressure on home prices.” 

Inventory levels have declined across properties priced below $1,000,000, with the steepest declines occurring for homes priced below $500,000. In March, there were 2,532 units in inventory, 22 per cent lower than last year and half the levels we traditionally see in March.

In March, the unadjusted total residential benchmark price rose to $597,600, a two per cent gain over last month and nearly 11 per cent higher than last year. Prices have increased across all property types, with the most significant year-over-year gains occurring for the relatively more affordable row and apartment-style homes.   

March 2024 City of Calgary Housing Stats

Detached

Detached home sales rose in March but were likely limited by the level of new listings coming onto the market. New listings in March were 1,386 units, compared to the 1,151 sales, causing the sales-to-new listings ratio to rise to 83 per cent. Inventories also remained relatively stable compared to last month but were 24 per cent lower than last year’s levels and nearly 60 per cent lower than long-term trends for March. Inventory levels dropped across all price ranges, but the most significant fall was in the lower price point. Overall, 71 per cent of the available inventory in March was priced above $700,000. 

Low inventories compared to sales caused the months of supply to drop below one month, driving further price gains. The unadjusted detached benchmark price rose to $739,700, a monthly gain of nearly three per cent and a year-over-year gain of 14 per cent. The largest year-over-year gains occurred in the most affordable North East and East districts.

Semi-Detached

Supply availability continues to weigh on the semi-detached sector of the market. In March, 260 new listings were met with 250 sales, causing the sale-to-new listings ratio to rise to 96 per cent. This prevented inventories from improving, and the months of supply dropped below one month. Inventory declines have been driven mainly by properties priced below $600,000.

Limited supply and growing demand drove further price gains in March. The unadjusted benchmark price reached $658,000, nearly three per cent higher than last month and a 14 per cent gain over last March. Prices rose across all districts in the city, with year-over-year gains ranging from a low of 11 per cent in the highest-priced area of the City Centre to 25 per cent in the lowest-priced market in the East district.

Row

Both sales and new listings rose in March. However, with 536 new listings and 449 sales, the sales-to-new listings ratio rose to 84 per cent, preventing any significant monthly change in inventory levels. With 355 units available, inventory levels were 12 per cent below last year’s and 53 per cent below long-term trends for March. The decline in inventory levels was driven by properties priced below $400,000, as inventory levels rose 35 per cent for units priced above $400,000. 

The unadjusted benchmark price trended up in March, reaching $448,700, a monthly gain of nearly three per cent and over 20 per cent higher than levels reported at this time last year. The higher-priced City Centre reported the slowest growth in benchmark prices, with the highest growth reported in the city's most affordable districts.

Apartment Condominium

Sales in March reached 814 units, contributing to the first quarter’s record-high sales of 1,940 units, nearly 31 per cent higher than last year. New listings also improved throughout the first three months of the year, but with a March sales-to-new-listings ratio of 82 per cent and a months-of-supply of one month, conditions favoured apartment condominium sellers. 

Demand for lower-priced homes has supported the growth of apartment-style properties, but the tight conditions have also contributed to further price gains. In March, the benchmark prices reached $337,700, over two per cent higher than last month and 17 per cent higher than levels reported last March.


REGIONAL MARKET FACTS

Airdrie

March reported 203 sales and 218 new listings. While both new listings and sales improved, with a sales-to-new listings ratio of 93 per cent, inventory levels were 22 per cent below last year and 56 per cent below typical March levels. 

With less than one month of supply, it is not surprising that we continue to see upward pressure on home prices. In March, the benchmark price reached $540,400, a monthly gain of two per cent and a year-over-year increase of over nine per cent. Prices improved across all property types, with stronger year-over-year gains for the relatively lower-priced row and apartment-style products.

Cochrane

Following a slower start to the year, sales in March rose to nearly the same level of new listings coming onto the market, pushing the sales-to-new listings ratio up to 99 per cent. This also contributed to further declines in inventory levels, and the months of supply dropped to just over one month. 

As of March, the total residential benchmark price reached $555,300, a monthly gain of over one per cent and a year-over-year increase of nearly 12 per cent. Prices rose across all property types, and detached prices pushed above $650,000 for the first time.

Okotoks

Okotoks continues to struggle with supply as the 71 new listings that came on the market this month were met with 65 sales, preventing any improvement in inventory levels. There were only 54 units available in March, a year-over-year decline of 10 per cent and nearly 70 per cent below long-term trends for the month. 

Limited supply and strong sales caused the months of supply to fall below one month, and March was the lowest March reported since 2006. Persistently tight conditions drove further price growth this month, as the total residential benchmark price rose to $610,700, a monthly gain of one per cent and a year-over-year increase of nine per cent. Prices have been rising for all property types, with the most significant year-over-year gains occurring for semi-detached and row properties.


Click here to view the full City of Calgary monthly stats package.

Click here to view the full Calgary region monthly stats package.

Read

Low inventory and high demand drive price gains in February

City of Calgary, March 1, 2024 – New listings continued to rise in February, reaching 2,711 units. However, the rise in new listings supported further growth in sales, which increased by nearly 23 per cent compared to last year for a total of 2,135 units. The shift in sales and new listings kept the sales-to-new listings ratio exceptionally high at 79 per cent, ensuring inventories remained near historic lows. Low supply and higher sales caused the months of supply to fall to just over one month, nearly as tight as levels seen during the spring of last year.

Purchasers are acting quickly when new supply comes onto the market, preventing inventory growth in the market," said Ann-Marie Lurie, Chief Economist at CREB®. “It is this strong demand and low supply that continues to drive price gains in Calgary. The biggest supply challenge is for homes priced under $500,000, which saw inventories fall by 31 per cent compared to last February. At the same time, we are starting to see supply levels rise for higher priced homes supporting more balanced conditions in the upper end.

In February, the unadjusted benchmark price was $585,000, an over two per cent gain compared to last month and over 10 per cent higher than levels reported at this time last year. Our most affordable East district is experiencing the highest year-over-year price growth at 25 per cent, while the relatively better-supplied City Centre has reported the slowest price growth in the city at under five per cent.

February Housing Stats

Detached

In February, 1,195 new listings came onto the market, of which 75 per cent were priced over $600,000. While new listings did improve over last month in line with seasonal expectations, levels are still below typical levels for February. At the same time, sales in February rose to 954 units, a year-over-year gain of 20 per cent. The growth in sales was driven by where we saw listings growth, but with a sales-to-new listings ratio of nearly 80 per cent, inventory levels were near record lows for February.

Exceptionally tight market conditions drove further price growth. In February, the unadjusted detached benchmark price rose to $721,300, nearly three per cent higher than last month and over 13 per cent higher than last February. While prices rose across every district, the most significant year-over-year gains occurred in the North East and East districts.

Semi-Detached

Last month’s rise in listings compared to sales was short-lived, as the 223 new listings this month were met with 191 sales, driving up the sales-to-new-listings ratio to 86 per cent. This prevented any significant change to the low inventory situation and caused the months of supply to fall to just over one month.

In February, the unadjusted benchmark price reached $639,100, a monthly gain of over two per cent and 13 per cent higher than last year. Year-over-year price gains ranged from a low of 10 per cent in the City Centre to over 26 per cent in the East district.

Row

New listings rose to 457 units in February, contributing to the year-to-date increase in new listings of 22 per cent. The rise in new listings supported sales growth, preventing any significant change to the low inventory situation. For the second consecutive month, the months of supply were below one month.

The exceptionally tight market conditions have contributed to strong price growth for row properties. In February, the unadjusted detached price reached $436,500, over 2 per cent higher than last month and nearly 19 per cent higher than levels reported last February. Prices rose across all districts, with the highest growth occurring in the most affordable districts.

Apartment Condominium

Sales in February reached 638 units, contributing to the year-to-date sales increase of 39 per cent. Relative affordability has supported the strong demand for apartment-style homes, and sales growth has been possible thanks to the continued growth in new listings. Inventory levels trended up over the last month in line with seasonal expectations. However, inventory levels declined by 12 per cent compared to last year, ensuring the market continued to favour the seller with just over one month of supply.

Persistently tight conditions continued to place upward pressure on home prices. Prices have steadily increased since January of last year, and as of February, they reached $329,600, a 17 per cent gain over last February. Prices rose across every district in the city, with year-over-year gains surpassing 19 per cent in all districts except the City Centre, which reported a year-over-year gain of 13 per cent.


REGIONAL MARKET FACTS

Airdrie

New listings in Airdrie improved in February. However, with 182 new listings and 135 sales, the sales-to-new listings ratio remained high, and inventory levels eased over last year's low levels. Inventory levels are half what we typically see in February and have not been this low since 2006.

The rise in sales compared to inventory levels caused the months of supply to drop to just over one month. Airdrie has struggled with limited supply over the past several years, driving home prices. In February, the unadjusted benchmark price reached $529,700, over one percent higher than last month and 10 per cent higher than the $479,700 price reported last February.

Cochrane

New listings rose to 105 units in February, the highest monthly total seen since July last year and contributing to the year-to-date gain of 22 per cent. At the same time, February sales improved over last year, with 65 sales.

With a sales-to-new listings ratio of 62 per cent, we did see some growth in inventory levels compared to last year. However, inventories remain well below what is typical for this market. Nonetheless, the months of supply remained relatively low for this market at two months, supporting further price growth in the town. As of February, the unadjusted benchmark price reached $548,300, an improvement over last month and over 11 per cent higher than levels reported last year.

Okotoks

For the second month in a row, new listings improved in Okotoks compared to last year. However, as sales also improved over the past two months, inventory levels in February remained stable compared to last month and only slightly higher than last year’s levels.  Inventory levels are near record lows for the month and are 63 per cent below long-term trends.

Okotoks has struggled to add enough supply to keep pace with demand, keeping conditions tight and driving home prices. As of February, the unadjusted benchmark price reached $605,500, nearly three per cent higher than last month and a 10 per cent gain over last year at this time.


Click here to view the full City of Calgary monthly stats package.

Click here to view the full Calgary region monthly stats package.

Read

CREB:January sees strong sales fueled by boost in new listings

Feb. 01, 2024 | CREB

January sees strong sales fueled by boost in new listings

City of Calgary, Feb. 1, 2024 – January sales rose to 1,650 units, a significant gain over last year's levels and long-term trends. The growth was possible thanks to a rise in new listings totalling 2,137 units in January. New listings rose for homes priced above $300,000, but the largest gains occurred for homes priced above $700,000.

The rise in new listings relative to sales did little to change the low inventory situation in the city. With 2,150 units in inventory, levels are near the January record lows set in 2006 and are nearly 49 per cent below the long-term average for the month.

"Supply challenges have been a persistent problem since last year. This month's gain in new listings has helped provide options to potential purchasers, supporting sales growth. However, the growth in sales prevented any significant adjustments in supply, keeping conditions tight and supporting further price growth," stated Ann-Marie Lurie, Chief Economist at CREB®.

The months of supply in January was 1.3 months, falling over last month's and last year's levels. The persistent tightness in the market contributed to further upward pressure on home prices. The unadjusted benchmark price in January reached $572,300, a gain over last month and ten per cent higher than levels reported last January.

Detached

A boost in new listings helped support stronger sales this month. However, with a sales-to-new-listings ratio of 77 per cent, there was minimal change in the low inventory situation reported in the detached sector. New listings rose for all homes priced above $500,000, but the largest gains occurred in the over $700,000 market segment. Low inventory levels compared to sales prevented any improvement in the months of supply, which at 1.4 months was lower than levels reported last month and last January.

The exceptionally tight market conditions continued to drive further price growth. In January, the unadjusted detached price reached $702,200, nearly one per cent higher than last month and nearly 13 per cent higher than prices reported last year. Year-over-year price gains ranged from a low of 10 per cent in the City Centre and South East districts to a 27 per cent gain in the East district of the city.

Semi-Detached

With 223 new listings and 131 sales, the sales-to-new listings ratio fell to 59 per cent, the lowest level reported since 2020 and significantly improved over the 82 per cent average reported in 2023. The sudden shift did cause inventories to improve over the last month, but they remain well below long-term trends.

The unadjusted benchmark price in January was $625,000, slightly lower than last month but over 11 per cent higher than last January. The monthly decline was driven mainly by adjustments in the higher-priced districts of the West and City Centre.

Row

Like other property types, new listings and sales rose in January over levels reported last month and last year. However, with 322 new listings and 297 sales, the sales to new listings ratio remained exceptionally high at 92 per cent. This contributed to further reductions in inventory levels, and the months of supply once again fell below one month.

Limited supply and strong demand contributed to a rise in prices. In January, the unadjusted benchmark price reached $426,400, up over last month and nearly 20 per cent higher than levels reported in January 2023. While year-over-year prices are higher in every district, the West and City Centre districts saw unadjusted benchmark prices ease slightly over December.

Apartment Condominium

Apartment-style properties continued to see the most significant gain in sales activity, rising to 488 sales in January, a year-over-year increase of 54 per cent. This was possible thanks to the growth in new listings. However, the gain in listings did little to supply levels; with 682 units, inventories were 40 per cent below long-term trends.

Tight market conditions continued to contribute to further price gains. In January, the unadjusted benchmark price reached $324,000, nearly one per cent higher than last month and 19 per cent higher than last January. Prices rose across all districts, with the largest year-over-year gains occurring in the most affordable districts of the North East and East.


REGIONAL MARKET FACTS

Airdrie

Stronger detached and row sales were enough to offset pullbacks in the semi-detached and apartment sectors, causing total residential sales to increase over levels reported last January. This, in part, was possible thanks to a boost in new listings. However, the boost in new listings and sales prevented any significant shift in inventory levels, which was half of the levels typically seen in the market.

While conditions remained tight, the unadjusted benchmark price remained stable over the last month but was nearly 10 per cent higher than levels reported in January 2023. The most substantial price gains have occurred for apartment-style homes, which are the most affordable property type.

Cochrane

Eighty-three new listings and 70 sales occurred in January, keeping the sales to new listings relatively high at 84 per cent. This prevented any significant change in inventory levels compared to last month but caused the months of supply to fall below two months once again. The drop in the months of supply is a shift over the last four months, where the months of supply was over two months.

Despite recent tightening, the unadjusted benchmark price did ease slightly over last month’s levels. Overall, the unadjusted benchmark prices across all property types remained over 10 per cent higher than last January.

Okotoks

Both sales and new listings rose in January compared to last month's and last year’s levels. This caused the sales to new listings ratio to fall to 75 per cent, which was still relatively high but an improvement over the 86 per cent average reported last year. Nonetheless, the sudden gain in new listings was insufficient to cause material changes to the low inventory levels.

With just over one month of supply, conditions remain tight in Okotoks, driving prices up. In January, the benchmark price reached $589,600, higher than last month's and year’s levels. Year-over-year price growth occurred across all property types, with gains ranging from a high of 15 per cent for row properties to a low of six per cent for apartment-style homes.


Click here to view the full City of Calgary monthly stats package.

Click here to view the full Calgary region monthly stats package.

Read

CREB: Increased listings, strong sales, and price growth

Increased listings, strong sales, and price growth

City of Calgary, Dec. 1, 2023 – New listings in November reached 2,227 units, nearly 40 per cent higher than the exceptionally low levels reported last year at this time. Gains in new listings occurred across most price ranges, but the most significant gains occurred from homes priced over $600,000.

Despite the year-over-year jump in new listings, inventory levels remained low thanks to relatively strong sales. With 1,787 sales in November, the sales to new listings ratio remained high at 80 per cent, and the months of supply remained below two months.

“Like other large cities, new listings have been increasing,” said CREB® Chief Economist Ann-Marie Lurie. “However, in Calgary, the gains have not been enough to change the low inventory situation thanks to strong demand. Our market continues to favour the seller, driving further price growth.”

As of November, the benchmark price was $572,700, up over last month and nearly 11 per cent higher than November 2022. Year-to-date, the average benchmark price has risen by over five per cent. 

City of Calgary November Housing Stats 

Detached

Limited supply choice for homes priced below $700,000 has been the primary cause of the decline in detached home sales. While November reported a marginal gain over last year, year-to-date sales have declined by 20 per cent. November saw a rise in new listings compared to the previous year, but higher-priced homes drove most gains. This has left the detached market with exceptionally tight conditions for prices below $700,000 and more balanced conditions for higher-priced homes. Overall, the month of supply remains exceptionally low at under two months.

Persistently tight conditions continue to cause further price gains in the detached market. As of November, the unadjusted benchmark price reached $699,500, a slight increase over last month and over 13 per cent higher than last November. While detached home prices are much higher than last year's levels in every district, year-to-date gains are the highest in the most affordable districts of the North East and East. 

Semi-Detached

November saw a boost in new listings compared to last year, helping to prevent a year-over-year decline in inventory levels. However, inventory levels are still over 40 per cent below typical levels seen in November. With a sales-to-new-listings ratio of 77 per cent and a month-of-supply below two months, conditions remain exceptionally tight, especially for homes priced below $700,000. 

Despite tight conditions, benchmark prices remained stable compared to last month. However, at an unadjusted benchmark price of $628,700, prices are still over 12 per cent higher than last year. The year-to-date average benchmark price has risen by nearly seven per cent, with the largest gains occurring in the North East and East districts.

Row

New listings rose again this month compared to last year. The 370 new listings were met with 267 sales, and for the first time since 2021, the sales-to-new-listings ratio fell below 75 per cent. The jump in new listings was enough to support a gain in inventory levels compared to last month and last year. While inventories are still nearly half the levels we traditionally see, this did help cause the months of supply to push up to 1.6 months, a significant improvement from the less than one month of supply that has persisted over the past seven months. While conditions are much more balanced in the higher price ranges, there is less than one month of supply for homes priced below $500,000.

Despite the shift away from exceptionally tight conditions, prices still rose over the last month and last year. As of November, the unadjusted benchmark price reached $429,100, 21 per cent higher than last November and an average year-to-date gain of nearly 13 per cent.

Apartment Condominium

Thanks to the relative affordability of the apartment-style homes, sales continued to reach record highs in November, contributing to year-to-date sales of 7,487. With one month left in the year, sales have already surpassed last year’s record high. This, in part, was possible thanks to the growth in new listings. While inventory levels are similar to levels reported last year, with less than two months of supply, conditions still favour the seller, placing further upward pressure on prices. 

The unadjusted November benchmark price reached $320,100 in November, a monthly gain of over one per cent and a year-over-year increase of 18 per cent. Year-to-date price gains have occurred across every district in the city, with some of the largest gains arising in the lower-priced North East and East districts.


REGIONAL MARKET FACTS

Airdrie

Gains in November sales were not enough to offset earlier pullbacks, leaving year-to-date sales down by over 26 per cent over last year's record levels. Much of the decline has been driven by the detached market, which has struggled with supply, especially in the lower price ranges. New listings in November did improve over last year's levels. Still, thanks to the gain in sales, the sales-to-new listings ratio rose to 96 per cent, preventing any significant shift from the low inventory levels. 

With less than two months of supply, we continue to see upward pressure on home prices. In November, the unadjusted benchmark price rose over last month, reaching $524,500, a year-over-year gain of 11 per cent. Year-to-date price gains have been the highest in the apartment sector at 17 per cent, with detached and semi-detached prices rising by nearly six per cent.

Cochrane

With 87 new listings and 51 sales, the sales-to-new listings ratio fell to 59 per cent in November, the first time it fell below 60 per cent since 2020. Higher-priced properties have primarily driven the recent gain in new listings. Improved new listings compared to sales did help support increases in inventory levels. However, November inventory levels remain over 30 per cent below long-term trends.

Tight market conditions have supported further price growth in Cochrane. As of November, the unadjusted benchmark price reached $548,600, a monthly gain of over one per cent and a year-over-year increase of 11 per cent. On average, year-to-date benchmark prices have increased across all property types, with the most significant gains occurring in the apartment condominium sector at over seven per cent.

Okotoks

November saw a boost in new listings, helping support some of the year-over-year gain in sales. The rise in new listings compared to sales also helped support gains in inventory levels. However, inventory levels are nearly half what we would typically see in the market in November. Nonetheless, the shift this month did help push the months of supply up to nearly two months. 

While the months of supply did improve, conditions remained exceptionally tight, and prices continued to trend up this month. As of November, the unadjusted benchmark price was $590,200, a one per cent gain over last month and over eight per cent higher than last November. 


Click here to view the full City of Calgary monthly stats package.

Click here to view the full Calgary region monthly stats package.

-30-

For more information, please contact:

Economic Analysis
Email: stats@creb.ca
Phone: 403-263-0530

Cid Hanna
Manager, Communication Services
Email: cid.hanna@creb.ca
Phone: 403-781-1326


Read
Data is supplied by Pillar 9™ MLS® System. Pillar 9™ is the owner of the copyright in its MLS®System. Data is deemed reliable but is not guaranteed accurate by Pillar 9™.
The trademarks MLS®, Multiple Listing Service® and the associated logos are owned by The Canadian Real Estate Association (CREA) and identify the quality of services provided by real estate professionals who are members of CREA. Used under license.